Perform significance testing (t/z testing) & correlation scans (crosstab) with visualization right on the survey results page with Correlation Finder.
Setting up a Correlation Finder
- On the Results page, click the Data Lab menu tab, and drag the Correlation Finder into place in your results.
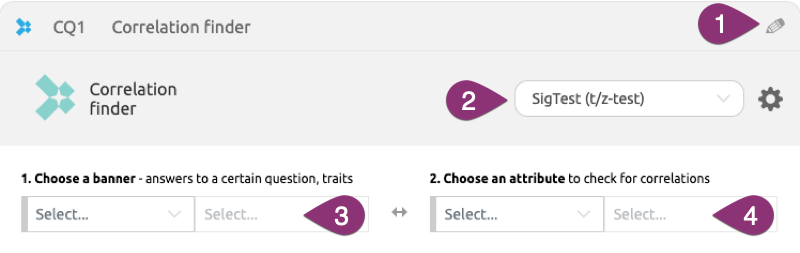
- Click the pencil icon to edit the name that appears in the Question Header.
- Click the drop-down and select SigTest (t/z test) or Crosstab (chi²).
- Click the Choose a banner drop-down to select a banner from the list of demographic traits, questions, codebooks, or Virtual Questions. Click the second banner drop-down to refine your variable.
Note: The banner should be the independent variable that you are studying; the underlying factor that can lead to statistical significance.
- Click the Choose an attribute drop-down to select an attribute to check for correlations.
Note: The attribute should be the dependent variable that you’re using to explore statistical significance.
- Click Generate data to populate the chart. Once a Correlation Finder is added to your stats report you can export the chart and data table to PowerPoint or download a static image of the chart.
|
 |
SigTest and Crosstab Chart Visualizations
|
Once the chart populates you can customize the visualization a few ways:
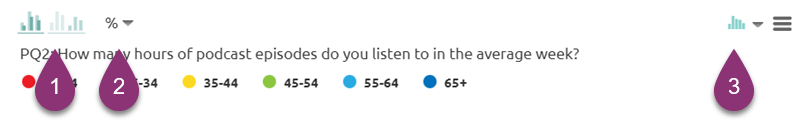
- Click the charts icon in the upper left corner to toggle between Interlaced Chart and Grouped Chart.
Interlaced Chart: organizes your data by attribute along the X-axis
Grouped Chart: organizes data by banner along the X-axis
- Click the % drop-down to toggle the view to actual numbers instead of percentages.
- Click the chart icon in the upper right corner to change the chart visualization output.
- Hover over the bars to view significance data.
|
 |
SigTest and Crosstab Table data
|
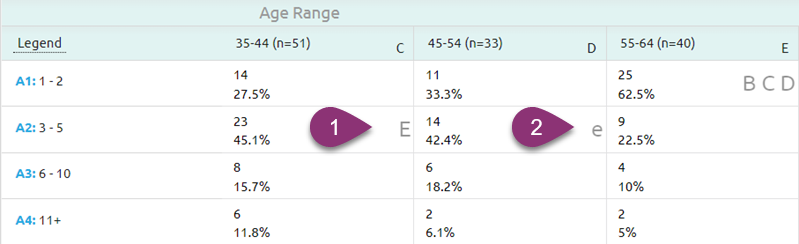
Cells marked with a capital letter indicate a statistically significant difference between that cell and the cell of the group indicated by the matching letter, at the primary confidence level (default 95%).
Cells marked with a lowercase letter indicate a statistically significant difference at the secondary confidence level (default 90%).
To change either of these confidence level thresholds, click the Banner Tables menu, and adjust the sliders accordingly.
|
 |
Crosstabs Data
|
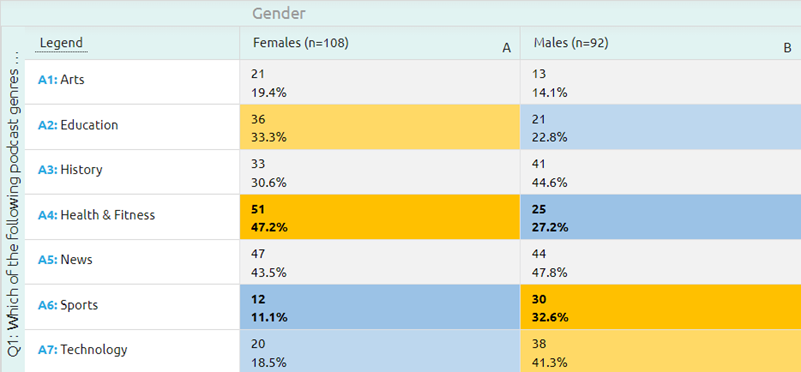
In a Crosstabs, color variation appears in the cells for which the null hypothesis (which says that the banner and attribute are completely independent) is rejected; there is statistical significance in the colored cells, indicating that the banner and attribute are related and not independent from one another. The darker the shading, the stronger the correlation.
- Click Legend in the upper left corner of the table to see the thresholds set for color variation.
|
 |
Changing confidence levels
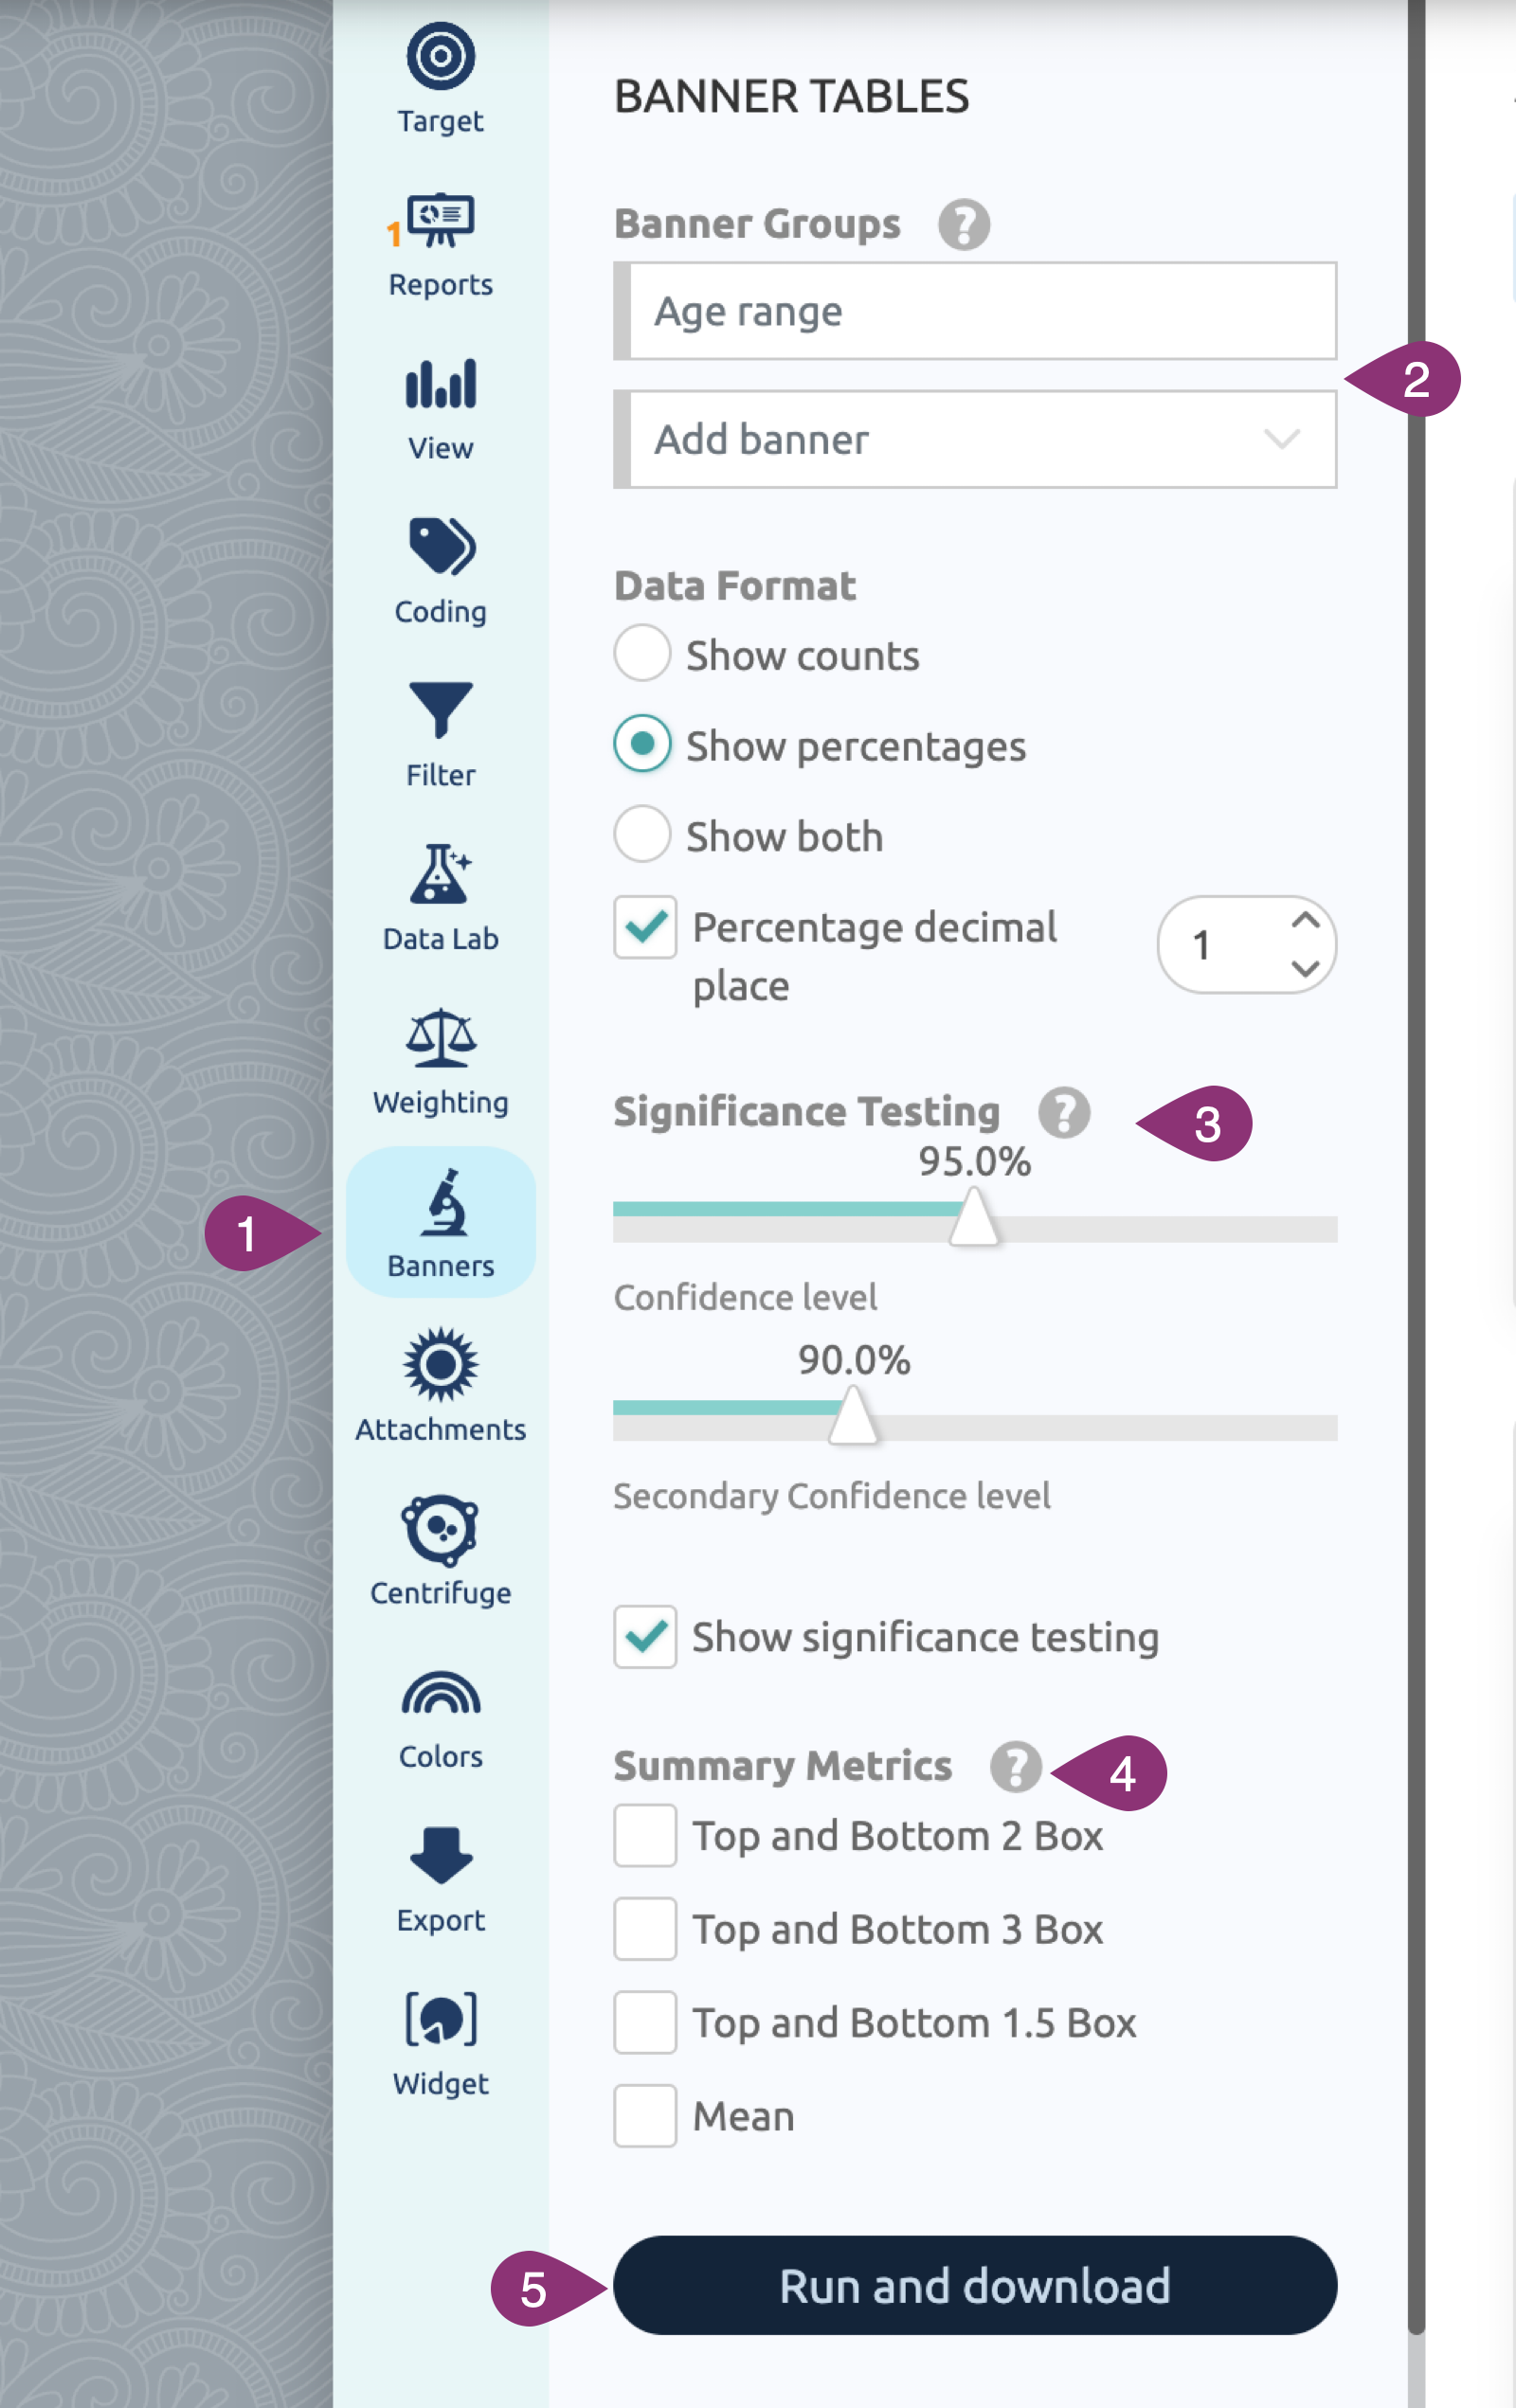
- Click on the Banner Tables menu tab in the left side menu.
- Adjust the sliders to your preferred primary and secondary confidence levels. Your Correlation Finder results will automatically update both in the tables and in the Legend.
|
 |
Comparing multiple banners, and finding p-values
- Click the Banner Tables menu.
- Click the drop-down to select from Banner Groups.
- Click the Add banner drop-down to select a banner to analyze. You may add as many banners as you like, from demographic traits to questions in your survey.
- Adjust Confidence levels, if needed.
- Check the box(es) next to the respective Summary Metrics you'd like to include.
- With all your banners added, click Run and Download to export a Traditional Significance Test with p-values
|
 |
Notes:
Correlation Finder supports the following question types as Banners: Radio Button, Checkbox, Reorder, Sliders, Progressive Matrix, Star/Smiley Rating, Polarity Scale, Side-by-Side, Rapid Association, Competitive Topography, Prequalification, and Virtual Questions.
Correlation Finder supports the following question types as Attributes: Radio Buttons, Checkboxes, Reorder, Sliders, Progressive Matrix, Star/Smiley Rating, Polarity Scale, Side-by-Side, Rapid Association, MaxDiff, Competitive Topography, Prequalification, and Virtual Questions.